Abstract
The number of people who may be exposed to a hazard is an essential component of risk analysis.
However, people regularly move between different areas both in terms of short trips (e.g. daily travel to work) and longer-term relocations or ‘changes in residence’ (e.g. migrations). This results in variations in the number of people in an area over time, both in the short-term (hourly, daily) and in the long-term (monthly, seasonal), and therefore how many people may be exposed to a hazard.
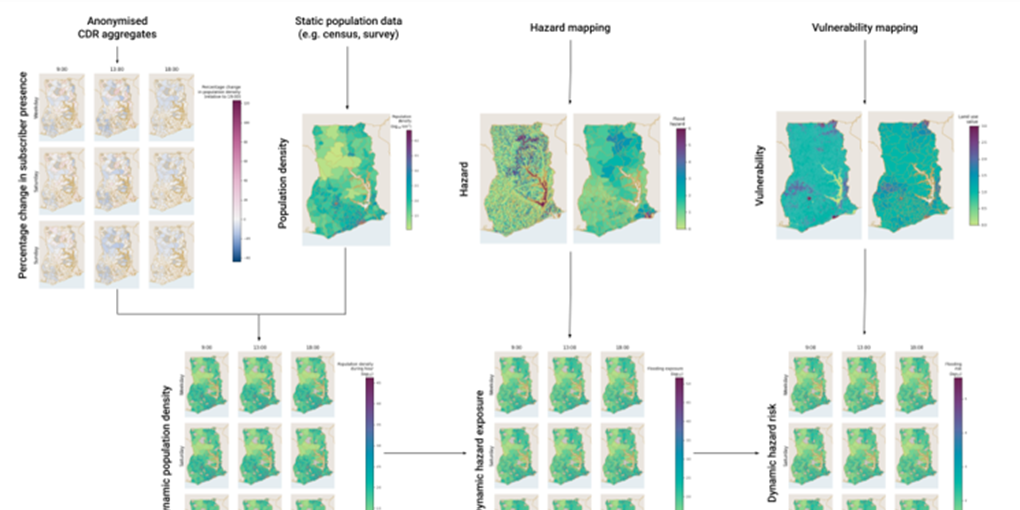
The purpose of this work is to derive dynamic indicators of hazard risk by combining static geospatial data on hazards and vulnerability, the two other components of the INFORM Risk model, with dynamic exposure indicators derived from aggregated and anonymised call detail records (CDR data).
In this report, we demonstrate the application of our framework for combining anonymised CDR aggregates with static population data and geospatial data on hazards and vulnerability to the case study of hourly variation in flooding risk in Ghana
About the project & its partners
Authors
This report was authored by the Flowminder Foundation, by Thomas Smallwood and Véronique Lefebvre.
Acknowledgements
This study was made possible thanks to the anonymised data provided by Vodafone Ghana, and the Data for Good partnership.
The Data for Good project is a unique public-private partnership and not-for-profit initiative between Ghana Statistical Service (GSS), Vodafone Ghana and Flowminder Foundation, to support evidence-based decision-making for the wellbeing of all in Ghana. The project received funding support from Vodafone Foundation and the William and Flora Hewlett Foundation.
