
Supporting the government of Nigeria with its COVID-19 vaccine delivery interventions through site placement optimisation
Understanding how far someone lives from a vaccination site or what could be done to improve access to this service is essential to successful immunisation interventions, particularly in the context of the COVID-19 pandemic, where governments are focusing their efforts on rolling out effective COVID-19 vaccine delivery interventions.
Using our site placement optimisation method, it is possible to identify locations for new sites and services that will help to achieve maximum population coverage. Applied to the COVID-19 context, this method aims to improve populations’ access to vaccination services.


Under the GRID3 programme, we worked with Nigeria’s Federal Ministry of Health to determine where new vaccination sites should be added to maximise population coverage.
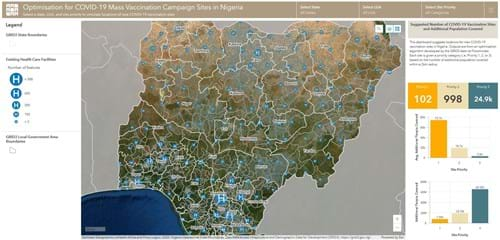
We produced optimisation outputs for the 36 states and the federal capital territory in Nigeria to identify potential locations for administering vaccines, ranked in order of three priorities. Results are being used by state health actors to plan their COVID-19 vaccination rollout and are openly available through an interactive dashboard. The work was first tested in two pilot states, Ogun and Lagos, before running the algorithm to cover the whole of Nigeria.
Data & methods
Using the GRID3 Nigeria gridded operational population estimates, as well as data on existing healthcare facilities and subnational boundaries, we simulated the placement of potential new vaccination service points to produce a national picture of the vaccination facility needs to reach maximum coverage.
We ran the algorithm for each state individually, which suggested the placement of ~26,000 new sites across the country. Outputs are available by states and local government areas (LGAs).
Each site was given a priority category (i.e. priority 1, 2, or 3) based on the number of additional populations covered within a 2km radius, as per government requirements.
Visualising and using the optimisation outputs for decision-making
The results were then uploaded onto ArcGIS Online, to produce an interactive and user-friendly dashboard, and help national state health actors visualise the extent of the work and maximise the administration of their COVAX/COVID-19 vaccines.
Data from the algorithm can help visualise the number of additional sites needed so that beneficiaries or vaccine teams only need to travel a set distance to receive/provide services.They can also help determine which areas to prioritise and/or to assess various coverage scenarios based on, for example, the highest number of people covered, main geographic areas of interest, and/or budget constraints.
To find out more about the work in Nigeria and how to use the outputs and a dashboard for decision making, read the guidance notes we produced for GRID3.
This document aims to help health planners incorporate their site placement optimisation outputs into COVID-19/COVAX plans and services. This document is aimed at anyone who is looking for new solutions to improve the efficiency and effectiveness of their vaccine delivery interventions, through better service coverage across the population of interest.
In this guide, you will learn:
- What is site placement optimisation?
- How to use the outputs for COVID-19 vaccinations?
- How to use an ArcGIS dashboard to interact with the outputs?
- How to use optimisation outputs for decision-making?
- What support is available from GRID3?
Photo credits: GRID3
