Understanding how people move to better plan for and respond to disasters
In Ghana, like any other country in the world, people move around a lot. Without understanding where people live and where they move to, the government of Ghana can with difficulty make adequate decisions for the wellbeing of its populations. This is particularly important for NADMO, Ghana's National Disaster Management Organisation.
NADMO needs to understand how many people are usually in a given region or district at a given time, to determine how many might be at risk when a disaster strikes. Knowing how people move, and how they may come into areas at risk of hazards and disasters, they can more effectively prepare for disasters, mitigate their impact, and eventually provide adequate support to those in need, when required.
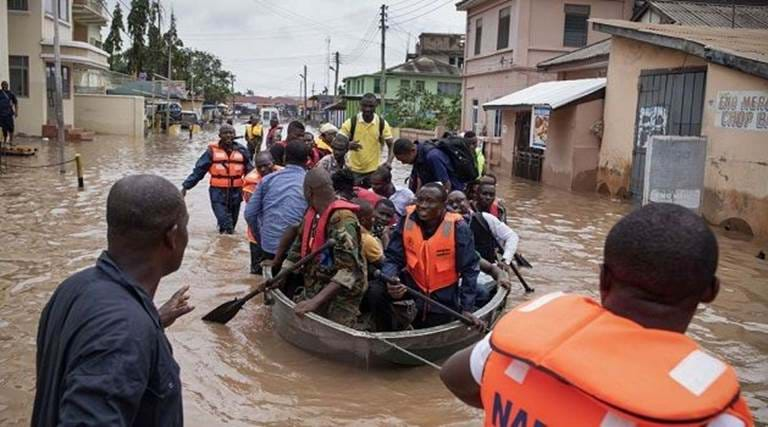
Photo credit: NADMO
Improving NADMO’s predictive capability of population at risks of flooding and drought in Ghana
To improve NADMO's predictive capability of populations at risk of disasters, Flowminder, through the Data for Good partnership with Vodafone Ghana and Ghana Statistical Service (GSS), is conducting a series of user engagement activities to better understand NADMO’s requirements and needs for the use of dynamic hazard risk mapping and analyses. Such work would involve identifying high risk locations and times of increased exposure levels, based on changes to population density. We are consulting with NADMO about the types of hazards within their portfolio to quantify exposure variations from a hazard to another based on population movements.
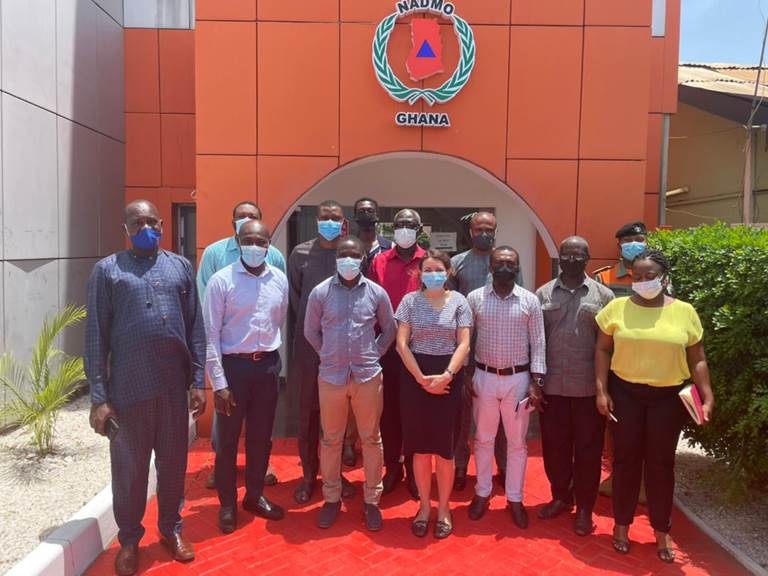
Photo: Flowminder & GSS visit to NADMO, May 2021
The number of people who may be exposed to a hazard (e.g. a flood) is an essential component of risk analysis.
However, this might be difficult to assess as people regularly move between different areas both in terms of short trips (e.g. daily travel to work) and longer-term relocations or ‘changes in residence’ (e.g. migrations). This results in variations in the number of people in an area over time, both in the short-term (hourly, daily) and in the long-term (monthly, seasonal), and therefore how many people may be exposed to a hazard at a given time.
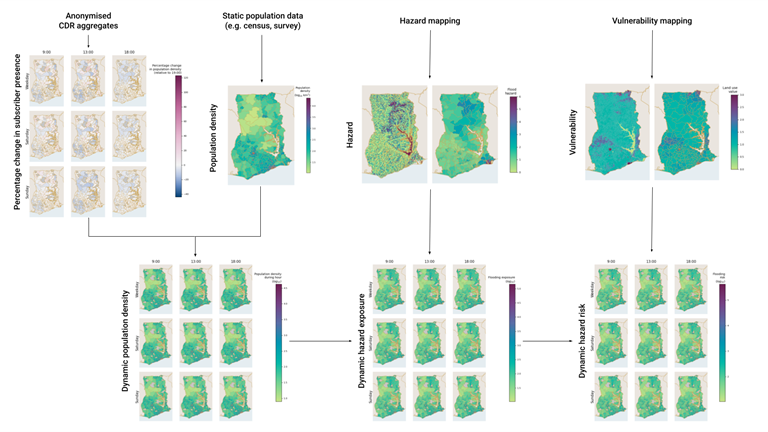
Flowminder is aiming to produce dynamic indicators of hazard risk across Ghana, with a particular focus on floods and drought, by combining static geospatial data on hazards and vulnerability with dynamic exposure indicators derived from aggregated and anonymised CDR data.
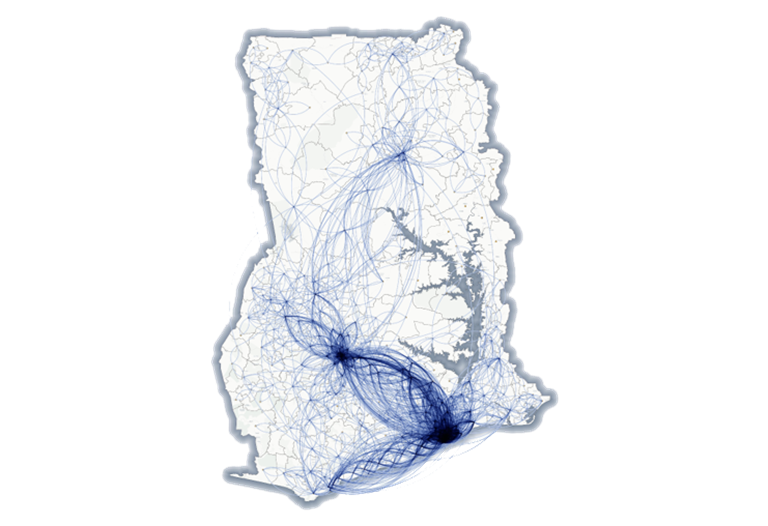
Map: Daily flows between districts in 2021 (Source: Flowminder)
Methodology
Input data
The dynamic hazard exposure mapping workflow has four data inputs:
- Pseudonymised mobile operator data (Call Detail Records, CDR data) provided by Vodafone Ghana, to estimate mobility across the country
- Static population data (2020 WorldPop gridded population density estimates), used to scale our subscriber presence indicator to population-level.
- Geospatial hazard and vulnerability data, provided by NADMO, and which provide information on which areas may be affected by a hazard, such as flooding or drought.
Outputs & methodology
The methodological overview for producing dynamic hazard maps is explained in the diagram below.
Resource | Video
Ghana | Improving NADMO’s predictive capability of populations at risk of disasters
In this video, we're looking into how we could use mobile operator data, and more specifically Call Detail Records, to support Ghana's National Disaster Management Organisation (NADMO)'s decision making and predictive capability of populations at risk of disasters.
Useful information & resources
We can use CDR data to estimate the number of people visiting or residing in an area and how this varies over different periods of time to calculate dynamic hazard risk indicators which take into account this variation in exposure.
CDR data has a range of other disaster preparedness and management applications, including:
- Estimating the number of internally displaced persons (IDPs) in each area
- Assessing the response to early warning systems in near-real time
- Determining whether IDPs are returning to affected areas
To find out more about the disaster preparedness and management applications of CDR data:
What to find out more?
If you want to find out more about our work in Ghana, or discuss how we can help you in your country, contact us:
