Changing patterns of human mobility can drive seasonal outbreaks of infectious diseases, but limited data about travel behavior and population flux over time have made this idea difficult to quantify. Mobile phone data provide a unique source of information about human travel. Here we quantify seasonal travel patterns using mobile phone data from nearly 15 million anonymous subscribers in Kenya. Using a rich data source of rubella incidence, we show that patterns of population fluxes inferred from mobile phone data are predictive of disease transmission and improve significantly on standard school term time and weather covariates, showing for the first time to our knowledge that mobile phone data capture epidemiologically relevant patterns of movement.
Abstract
Changing patterns of human aggregation are thought to drive annual and multiannual outbreaks of infectious diseases, but the paucity of data about travel behavior and population flux over time has made this idea difficult to test quantitatively. Current measures of human mobility, especially in low-income settings, are often static, relying on approximate travel times, road networks, or cross-sectional surveys. Mobile phone data provide a unique source of information about human travel, but the power of these data to describe epidemiologically relevant changes in population density remains unclear. Here we quantify seasonal travel patterns using mobile phone data from nearly 15 million anonymous subscribers in Kenya. Using a rich data source of rubella incidence, we show that patterns of population travel (fluxes) inferred from mobile phone data are predictive of disease transmission and improve significantly on standard school term time and weather covariates. Further, combining seasonal and spatial data on travel from mobile phone data allows us to characterize seasonal fluctuations in risk across Kenya and produce dynamic importation risk maps for rubella. Mobile phone data therefore offer a valuable previously unidentified source of data for measuring key drivers of seasonal epidemics.

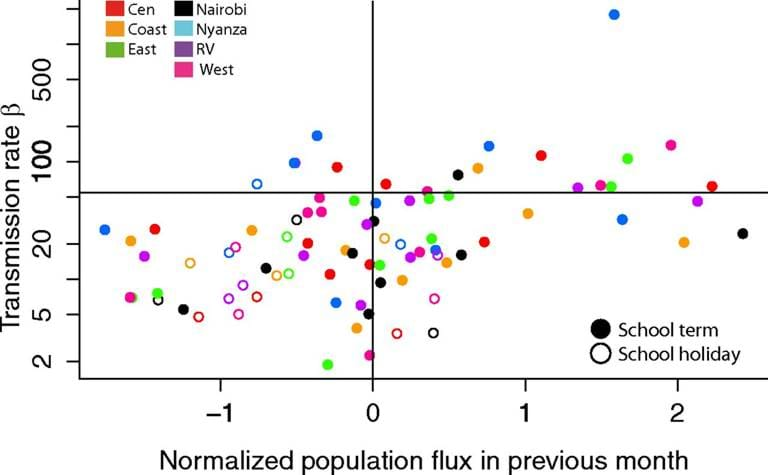
The relationship between transmission and population flux. The normalized population flux in the previous month is compared with the transmission rate for each province. Points representing months during which school terms are occurring (filled points) and not (empty points) showing that the population flux data are able to describe more variability in population dynamics than the binary school term measure.